 |
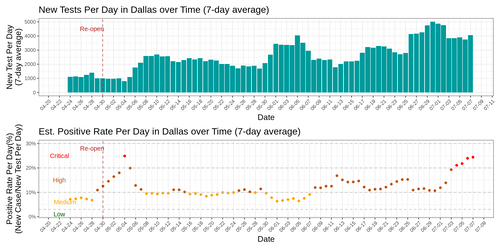
7/7/2020
Most website/summary reports COVID-19 positive test-rate at the state-level. This shiny dashboard plots COVID-19 positive test rate for Texas counties with > 3000 total tests performed. Data obtained from the Texas Department of State Health Services |
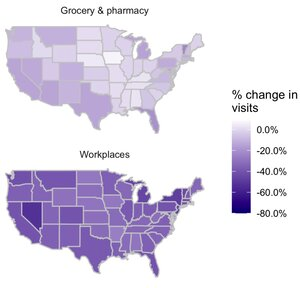 |
4/26/2020
Plotting percentage change in visits to different category of places for each state Data table of percent change visits extracted from Google Community Mobility Report Darker color indicates 'decrease' in mobility |
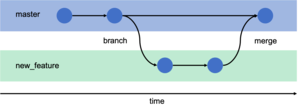 |
9/17/2019
Brief introduction to Git & GitHub ebook (using bookdown) Covers using Git for version control and sharing/collaborating on GitHub Accompanied with Git & GitHub Workshop at CVL, Fall 2019. |
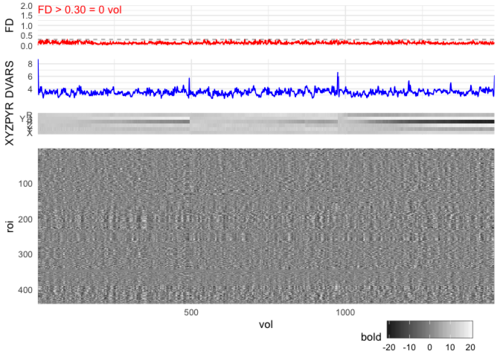 |
8/23/2019
R code on how to make fMRI QC plot similar to those shown in Power, 2017 NeuroImage article.It aligns the fMRI time series by voxels/ROIs (bottom gray plot) with motion/signal QC plots (top), making it easy to spot global changes in fMRI signals and potentially relate them to motion or other signals. It uses several small functions available on my GitHub repository, r-for-brain-network. |
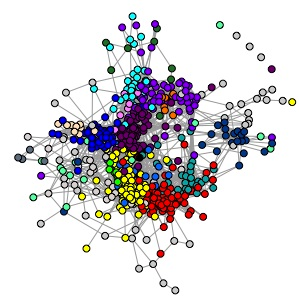 |
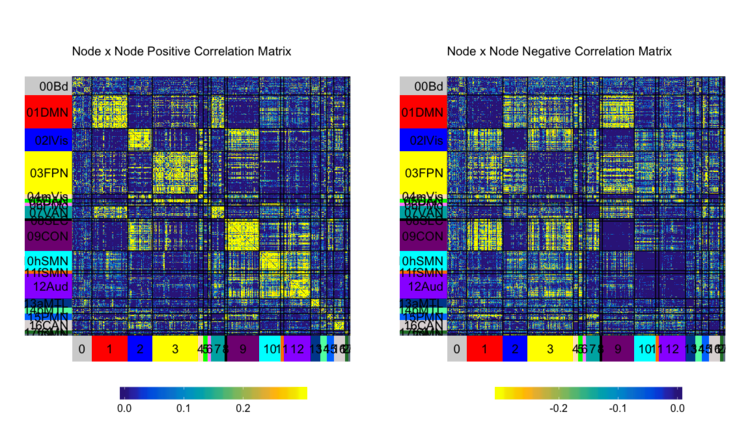
6/11/2019
This post outlines using R for brain network analysis. Starting from loading in CIFTI files, extracting time series using CIFTI parcels, constructing network matrix, visualization of matrix and spring-embedded graph, and some basic network analysis.
|